Tarrant County, Texas
| Tarrant County, Texas | |
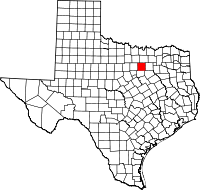
 Location in the state of Texas |
|
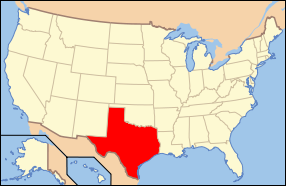
 Texas's location in the U.S. |
|
| Founded | 1849 |
|---|---|
| Seat | Fort Worth |
| Largest city | Fort Worth |
| Area - Total - Land - Water |
897 sq mi (2,324 km²) 863 sq mi (2,236 km²) 34 sq mi (88 km²), 3.80% |
| PopulationEst. - (2007) - Density |
1,717,435 1,990/sq mi (768/km²) |
| Time zone | Central: UTC-6/-5 |
| Website | www.tarrantcounty.com |
Tarrant County is a county located in the U.S. state of Texas. As of 2007, it had a population of 1,717,435. Its county seat is Fort Worth.[1] Tarrant County is the second most populous county in the Dallas/Fort Worth Metroplex and contains its second and third largest principal cities. The county is named in honor of General Edward H. Tarrant.[2]
Fort Worth is the largest city in Tarrant County with a population of 653,320 as of 2006,.[3] Arlington is the second largest city with population of 367,197 in 2006 and North Richland Hills is the third largest with 65,750 residents as of 2006.
Contents |
Geography
According to the U.S. Census Bureau, the county has a total area of 897 square miles (2,324 km²), of which, 863 square miles (2,236 km²) of it is land and 34 square miles (88 km²) of it (3.80%) is water.
Major highways
|
|
|
Adjacent counties
- Denton County (north)
- Dallas County (east)
- Ellis County (southeast)
- Johnson County (south)
- Parker County (west)
- Wise County (northwest)
Demographics
| Historical populations | |||
|---|---|---|---|
| Census | Pop. | %± | |
| 1900 | 52,376 |
|
|
| 1910 | 108,572 | 107.3% | |
| 1920 | 152,800 | 40.7% | |
| 1930 | 197,553 | 29.3% | |
| 1940 | 225,521 | 14.2% | |
| 1950 | 361,253 | 60.2% | |
| 1960 | 538,495 | 49.1% | |
| 1970 | 716,317 | 33.0% | |
| 1980 | 860,880 | 20.2% | |
| 1990 | 1,170,103 | 35.9% | |
| 2000 | 1,446,219 | 23.6% | |
| Est. 2006 | 1,671,295 | 15.6% | |
As of the census[4] of 2000, there were 1,446,219 people, 533,864 households, and 369,433 families residing in the county. The population density was 1,675 people per square mile (647/km²). There were 565,830 housing units at an average density of 655 per square mile (253/km²). The racial makeup of the county was 71.23% White, 12.80% Black or African American, 0.57% Native American, 3.64% Asian, 0.16% Pacific Islander, 9.09% from other races, and 2.51% from two or more races. 19.73% of the population were Hispanic or Latino of any race.
There were 533,864 households out of which 36.80% had children under the age of 18 living with them, 52.60% were married couples living together, 12.20% had a female householder with no husband present, and 30.80% were non-families. 24.90% of all households were made up of individuals and 5.90% had someone living alone who was 65 years of age or older. The average household size was 2.67 and the average family size was 3.22.
In the county, the population was spread out with 28.10% under the age of 18, 10.00% from 18 to 24, 33.50% from 25 to 44, 20.10% from 45 to 64, and 8.30% who were 65 years of age or older. The median age was 32 years. For every 100 females there were 98.10 males. For every 100 females age 18 and over, there were 95.60 males.
The median income for a household in the county was $46,179, and the median income for a family was $54,068. Males had a median income of $38,486 versus $28,672 for females. The per capita income for the county was $22,548. About 8.00% of families and 10.60% of the population were below the poverty line, including 13.80% of those under age 18 and 8.70% of those age 65 or over.
Tarrant County has one of the nation's highest property tax rates. In 2007, it was ranked in the Top 25 for property taxes as percentage of the homes value on owner occupied housing ranking 15th.[5]
High property tax rates can reduce a home's value significantly, leading to less resale value and negative equity upon ownership of the home. Part of this is due to the complex Robin Hood plan school funding mechanism in Texas.[6]
Politics
Tarrant County has consistently supported Republican Party candidates in recent decades. Since 1960 it has supported the Republican presidential candidate in every election except 1964.
Major Political Parties
- Republican Party of Tarrant County official website
- Democratic Party of Tarrant County official website
| Year | Democrat | Republican |
|---|---|---|
| 2008 | 43.8% 274,101 | 55.6% 347,843 |
| 2004 | 37.01% 207,286 | 62.39% 349,462 |
| 2000 | 36.78% 173,758 | 60.74% 286,921 |
| 1996 | 41.60% 170,431 | 50.85% 208,312 |
| 1992 | 33.14% 156,230 | 38.90% 183,387 |
| 1988 | 38.19% 151,310 | 61.24% 242,660 |
| 1984 | 32.57% 120,147 | 67.25% 248,050 |
| 1980 | 39.69% 121,068 | 56.86% 173,466 |
| 1976 | 49.18% 122,287 | 50.05% 124,433 |
| 1972 | 31.29% 69,187 | 68.55% 151,596 |
| 1968 | 41.79% 79,705 | 42.88% 81,786 |
| 1964 | 62.98% 97,092 | 36.71% 56,593 |
| 1960 | 44.66% 59,385 | 54.75% 72,813 |
Cities and towns
|
|
|
* Mostly in Dallas County
** Mostly in Denton County
*** Mostly in Johnson County
**** Mostly in Wise County
***** Partly in Johnson and Ellis Counties
† Partly in Parker County
†† Partly in Wise County
††† Small portion in Dallas County
†††† Small portion in Denton County
††††† Partly in Parker and Wise Counties
Education
Colleges and Universities
Primary and Secondary schools
Public schools in Texas are organized into Independent School Districts and charter schools. Tarrant County is also home to dozens of private high schools and nearly 100 lower-level private schools.[7]
Independent School Districts
- Arlington Independent School District
- Birdville Independent School District
- Carroll Independent School District
- Castleberry Independent School District
- Eagle Mountain-Saginaw Independent School District
- Everman Independent School District
- Fort Worth Independent School District
- Grapevine-Colleyville Independent School District
- Hurst-Euless-Bedford Independent School District
- Keller Independent School District
- Kennedale Independent School District
- Lake Worth Independent School District
- White Settlement Independent School District
- Azle Independent School District (partial)
- Burleson Independent School District (partial)
- Crowley Independent School District (partial)
- Godley Independent School District (partial)
- Mansfield Independent School District (partial)
- Northwest Independent School District (partial)
Charter schools
- Crosstimbers Academy
Private Schools
Notable private schools include:
- Fort Worth Christian School
- Nolan Catholic High School
- Trinity Valley School
- Key School, Inc.
Transportation
Dallas/Fort Worth International Airport is partially in the cities of Grapevine and Euless in Tarrant County and Irving in Dallas County.
References
- ↑ "Find a County". National Association of Counties. http://www.naco.org/Template.cfm?Section=Find_a_County&Template=/cffiles/counties/usamap.cfm. Retrieved 2008-01-31.
- ↑ http://www.tshaonline.org/handbook/online/articles/TT/hct1.html
- ↑ "Table 1: Annual Estimates of the Population for Incorporated Places Over 100,000, Ranked by July 1, 2006 Population: April 1, 2000 to July 1, 2006" (CSV). 2005 Population Estimates. United States Census Bureau, Population Division. 2007-06-28. http://www.census.gov/popest/cities/tables/SUB-EST2006-01.csv. Retrieved 2007-06-28.
- ↑ "American FactFinder". United States Census Bureau. http://factfinder.census.gov. Retrieved 2008-01-31.
- ↑ http://www.taxfoundation.org/research/show/1888.html Taxfoundation.org
- ↑ http://query.nytimes.com/gst/fullpage.html?res=9F04E5DB173BF934A35753C1A9629C8B63 Query.nytimes.com
- ↑ Texas Private Schools, accessed 2008-08-23
External links
- Tarrant County official website
- Headlines from Tarrant County from The Dallas Morning News
- Historic images of Tarrant County
- Tarrant County in Handbook of Texas Online from The University of Texas at Austin
- Tarrant County profile from The County Information Project
- Sketch of the Tarrant County Courthouse from A pictorial history of Texas, from the earliest visits of European adventurers, to A.D. 1879, hosted by the Portal to Texas History.
 |
Wise County | Denton County |  |
|
| Parker County | Dallas County | |||
| Johnson County | Ellis County |
|
||||||||||||||||||||
|
|||||||||||||||||
|
|||||||||||||||||